

- Studio Vektor
- Interactive eBooks
- Ramp: Business Spending Report
Case study · Interactive report
Business Spending Report, from print charts to live data stories
Data reports are built on charts, and charts in a PDF can only be looked at. The interactive edition of Ramp’s Summer 2026 report asks readers to guess before they look, find their own sector and size, and benchmark their AI spend, across 17 charts redrawn from the print.

- Publisher
- Ramp
- Original format
- 30-page PDF report (about 33 MB)
- Edition
- 4 chapters, 17 charts, 12 signals
- Status
- Independent portfolio demonstration
An interactive edition of a report Ramp published. Body copy, chart titles, chart data, source lines and the About text are from the report; the gists, editor’s notes, deep dives, glossary, widget prompts, quiz explanations and sample discussion threads were written for this edition by Studio Vektor. Not commissioned by, affiliated with or endorsed by Ramp. Labelled chart values are exact; monthly paths between them are traced from the print charts and are approximate.
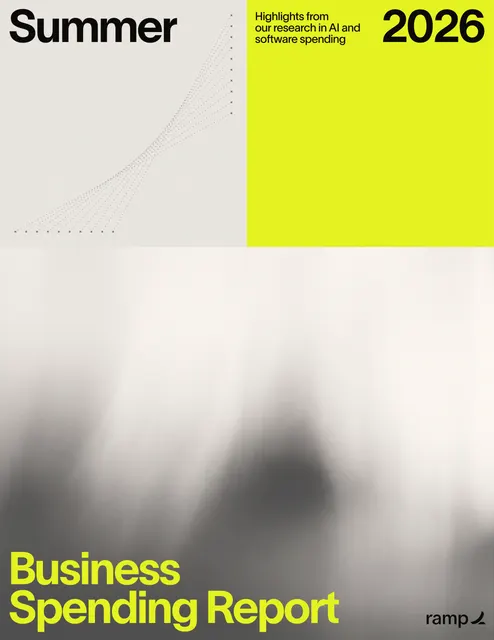
The starting point: a chart-led data report
Ramp’s quarterly report draws on its customers’ business spend to track AI adoption, spend per employee, AI’s effect on headcount, how software vendors charge for AI, and lighter “watercooler” findings on travel and coffee. In print it is 30 pages and 17 charts, most of them monthly lines across many series. Readers look for their own sector or state and have to find it among everyone else’s.
The brief
Every reader of a spending report asks the same thing: what about businesses like mine? The edition had to answer that with the report’s own data.
Make readers commit first
Ask for a guess before showing the number, so the headline findings land as surprises rather than statistics.
Put the reader in the chart
Let readers pick their sector, size, state and spend, so their line stands out and the rest step back.
Be clear about precision
Redrawn charts keep labelled values exact and say where monthly paths are traced from the print.
Who it is for
Finance leaders, founders and operators tracking what other businesses spend on AI and software.
Finance leaders
Benchmark AI spend per employee and compare seat-based with usage-based pricing.
Founders and operators
Find their sector and company size in the adoption data and see where their state ranks.
Skimmers
Take the Quick track through the key findings and the charts, guessing as they go.
From PDF to edition, chapter by chapter
Each chart keeps its number from the print, and each section shows its page range.
| Chapter | The report’s finding | In the interactive edition |
|---|---|---|
| Introduction (pp. 3–5) | A note from Ramp’s economist, about the report and key findings | A read-aloud economist’s note, the key findings and a choice of Quick or Deep track |
| 1 · Ramp AI Index (pp. 6–14) | Business AI adoption reaches 55.7%; Anthropic passes OpenAI; spend per employee varies by size and financing; Delaware leads the states | Charts 01–08: a guess-the-rate opener, a playable model race, a peer finder, a spend-per-head benchmark and a state tile map |
| 2 · AI’s impact on jobs (pp. 15–17) | Total and entry-level headcount rise after heavy AI adoption | Charts 09–10: predict the effect before the chart unlocks, and a 14-second loop explaining how the study works |
| 3 · Ramp Rate (pp. 18–21) | Traditional SaaS vendors increasingly charge for AI; usage-based billing costs far more than seats | Charts 11–13: a grid of 100 vendors over time and a seat-or-usage calculator |
| 4 · Watercooler data (pp. 22–26) | Starbucks leads business-trip dining; flight and World Cup hotel prices rise; NYC keeps its hot coffee | Charts 14–17: guess the most-expensed chain and a trip budget check |
| Back matter (p. 27) | Sources, data notes and About Ramp | A five-question quiz linked to its charts, sources and data notes, and notes on how this edition was made |
What Studio Vektor did
Redrew the report’s charts as live elements and gave each a question to answer.
Redrew 17 charts
Charts 01–07, 09–13 and 17 are redrawn from the print as live lines with exact labelled values. The state map and the travel charts use the printed figures directly.
Asked for a guess first
Readers lock in a guess for the adoption rate, the headcount effect and the most-expensed chain before the answer appears.
Built benchmarks from the data
Monthly AI spend and headcount give a spend-per-head figure set against the report’s top adopters, financing types and company sizes. Nothing leaves the browser.
Kept the lighter side
The watercooler findings became small games and a trip budget check, so the report ends on something readers want to share.
The 12 signals
Each interaction lights a signal, and the header’s adoption stage moves on as the reader uses more of the report.
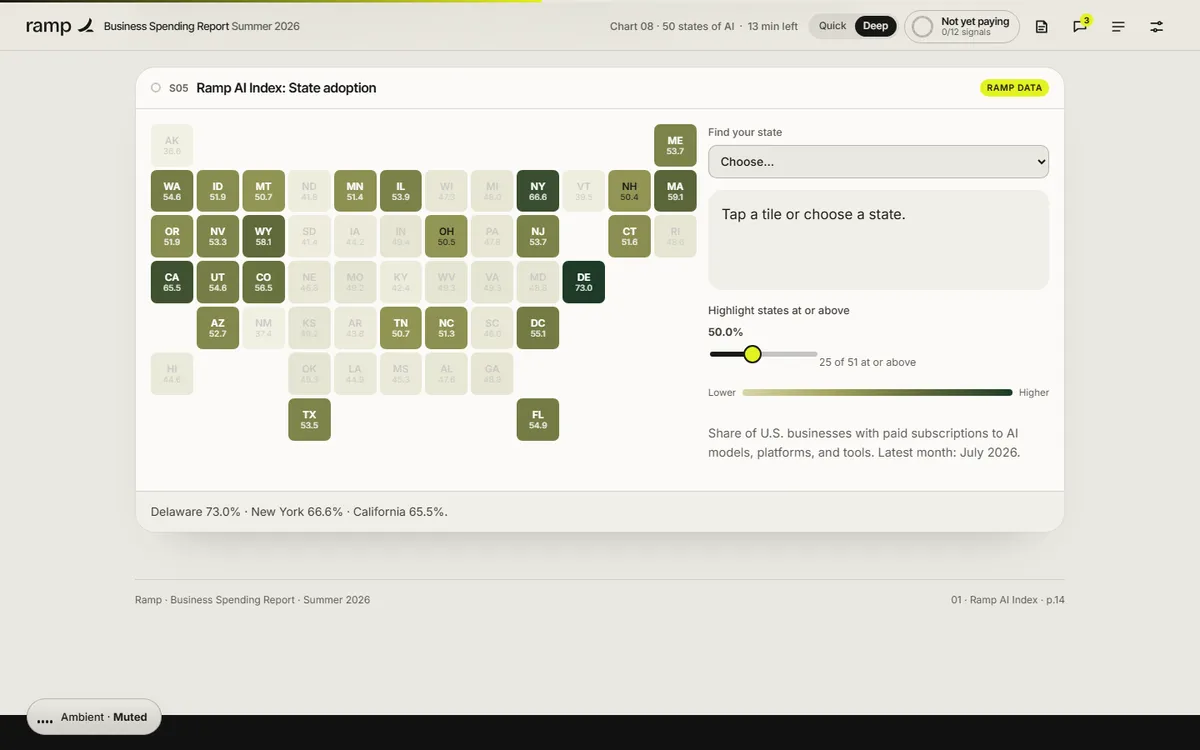
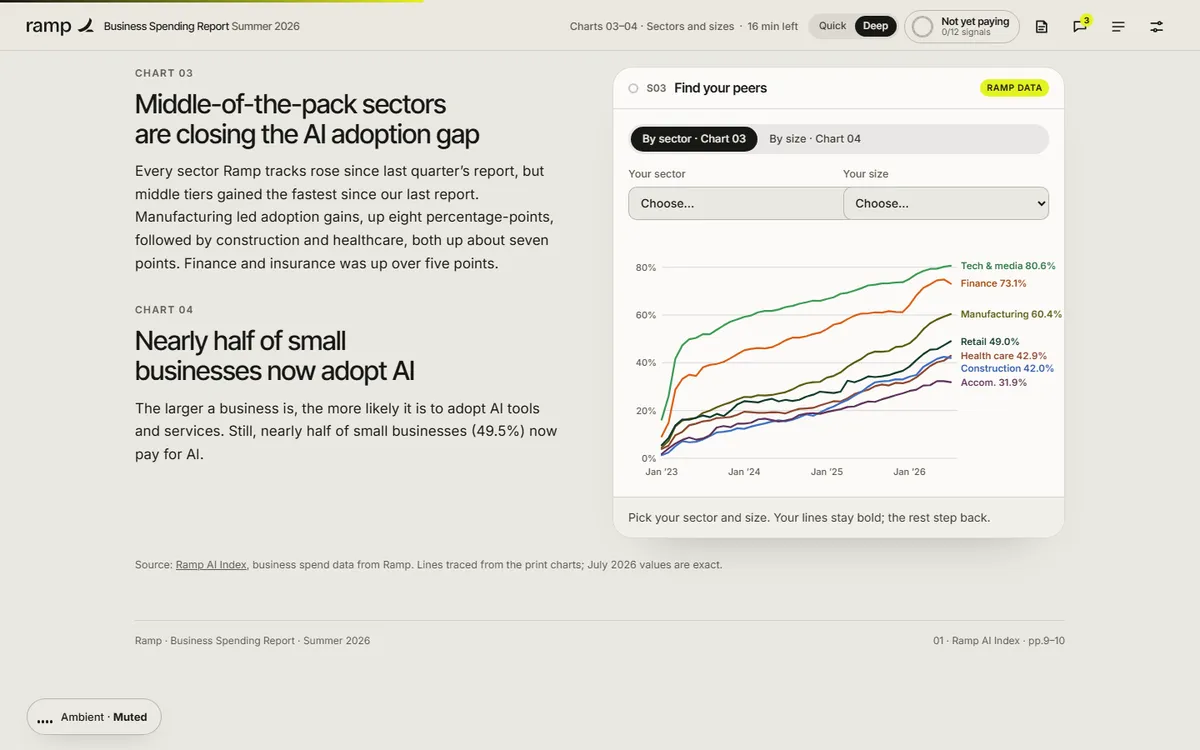
| Signal | Type | What the reader does |
|---|---|---|
| 01 · Guess the adoption rate | Prediction | Guesses the share of businesses paying for AI, then drags through time to compare two estimates (Chart 01) |
| 02 · The model race | Playable chart | Plays or drags the months and watches the lead change hands (Chart 02) |
| 03 · Find your peers | Filter | Picks a sector and a size to bring their lines forward (Charts 03–04) |
| 04 · Benchmark your spend | Calculator | Enters monthly AI spend, headcount and financing to compare spend per head (Charts 05–07) |
| 05 · State adoption | Tile map | Finds their state and sets a threshold (Chart 08) |
| 06 · Predict, then explore | Prediction | Predicts what happens to headcount after heavy adoption, then explores the curves with confidence bands (Charts 09–10) |
| 07 · How the study works | 14-second loop | Watches how firms are matched and tracked in the study |
| 08 · Who’s charging for AI | Animated grid | Drags the months across 100 traditional SaaS vendors (Charts 11–12) |
| 09 · Seat or usage? | Calculator | Enters what they pay for seat-based AI and sees the report’s median usage multiple (Chart 13) |
| 10 · Most-expensed chain | Prediction | Picks the chain they think leads business-trip dining to reveal the top 10 (Chart 14) |
| 11 · Trip budget check | Calculator | Chooses a route, hotel month and nights to estimate a trip (Charts 15–16) |
| 12 · Quiz | Checkpoint | Answers three multiple-choice and two true-or-false questions, each explanation linking back to its chart |
Reading experience and accessibility
Thirty pages become one continuous report that reads well on a phone.
Two tracks
A Quick overview with key findings, gists and every chart, or a Deep track with the full text and editor’s notes.
Listen along
The economist’s note can be read aloud with sentence tracking, using the reader’s device voice.
Reading settings
Text size, Auto, Light, Dark and Sepia themes, dyslexia-friendly type, bionic emphasis, margin notes and calm motion.
Charts as real elements
Charts are drawn in the page, so they stay sharp, scale to the screen and can be read by assistive technology.
Announced results
Twenty-two live regions announce chart readouts, benchmark results and quiz feedback.
Highlights and print
Readers can highlight passages to revisit, print the report, and keep their progress in the browser.
Design system
Ramp’s near-black and signal yellow carry from the cover into every chart, with warm paper tones for reading.
- Ramp yellow
#E4F222Cover, actions and highlights - Ink
#181816Text and dark panels - Paper
#F2F1ECReading background - Olive
#9AA80AYellow on light backgrounds - Chart accents
#6FD08A → #FF8A6ESeries and comparisons
Type
Inter Tight for display and chart titles, Inter for reading, and Atkinson Hyperlegible for the dyslexia-friendly mode.
Chart numbers kept
Every chart keeps its print number and source line, so a figure can be cited straight from the edition.
Precision stated
The About this edition section says which charts are redrawn, which use printed figures and which values are exact.
How it’s built
Ramp publishes this report every quarter. The build is designed so next quarter’s data drops in.
| Aspect | Approach |
|---|---|
| Delivery | One self-contained HTML file (about 270 KB, against a 33 MB PDF). No platform, plugin or reader app. |
| External requests | Only the web fonts, with system-font fallbacks |
| Data | Chart series held as data in the page and drawn as SVG, so a new quarter’s figures replace this one’s without redrawing |
| Narration | The reader’s device voice through the Web Speech API, with sentence tracking |
| State | Guesses, benchmarks, highlights and settings saved in the reader’s browser; nothing is sent to a server |
PDF vs interactive edition
The PDF is the record. The edition is how readers find themselves in it.
| Question | Original PDF | Interactive edition |
|---|---|---|
| How does my sector compare? | Find one line among many | Pick it and the rest step back |
| Is our AI spend normal? | Read medians off a chart | Enter your numbers and see spend per head |
| Where does my state rank? | A static map | Tap your state or set a threshold |
| Seat or usage pricing? | A median multiple | Apply it to your own bill |
| How heavy is it? | About 33 MB | About 270 KB, and it works on a phone |
What we would measure
This edition is an independent demonstration with no audience data, and we don’t report results for it. For a data publisher, readers’ choices are useful signals.
Audience mix
Sectors, sizes and states readers pick describe the audience better than a download count.
Surprise
The gap between readers’ guesses and the real figures shows which findings to lead with in campaigns.
Intent
Benchmarks completed, quiz completion and clicks from About Ramp to the product.
Where this approach fits
Recurring data reports gain the most: the interactions are built once and the data changes each edition.
Quarterly and annual indexes
Reports built on the publisher’s own data, where readers want their slice.
Pricing and spend benchmarks
Reports where a calculator applies a median to the reader’s own numbers.
Economic research
Studies with a method worth explaining, where a short loop replaces a methods page.
FAQ
Common questions about this edition and projects like it.
Was this edition commissioned by Ramp?
No. It is an independent portfolio demonstration built from a report Ramp published. The data and findings are Ramp’s; the editorial layer, interactions, design and build are Studio Vektor’s.
Are the charts accurate?
Labelled values, such as end points, table figures and map values, match the report exactly. Monthly paths between them are traced from the print charts and are approximate, as the edition states.
What would an edition like this cost?
Interactive eBooks start from $635, and the Advanced package with one defined quiz or scoring tool and interactive charts starts from $1,170. An edition at this depth, with 17 redrawn charts and twelve signals, goes beyond those packages and is quoted on scope after we see your report.
Can next quarter’s report reuse the build?
Yes. The charts read from data in the page, so a new quarter’s figures can replace the old ones and the interactions carry over.
Publishing data reports?
Let readers find themselves in your data.
Indexes, benchmarks and recurring reports are ideal. Send the report and we’ll show you how.