

- Studio Vektor
- Interactive eBooks
- Datadog: AI Playbook for Engineering Leaders
Case study · Interactive playbook
AI Playbook for Engineering Leaders, from PDF to working plan
Playbooks tell leaders what to do; few help them decide where to start. The interactive edition of Datadog’s playbook lets readers diagnose their own symptoms, test the ideas in small simulations and leave with a four-step plan, with the playbook’s text and footnotes kept as published.

- Publisher
- Datadog
- Original format
- 19-page PDF eBook
- Edition
- 6 chapters, 12 signals, a shareable readout
- Status
- Independent portfolio demonstration
An interactive edition of an eBook Datadog published. The playbook’s text, customer proof points and footnotes are as published; the gists, margin notes, simulations, scenarios, planner and quiz were written for this edition by Studio Vektor and are labelled as such. Not commissioned by, affiliated with or endorsed by Datadog. Simulated data and illustrative timings are set for demonstration.

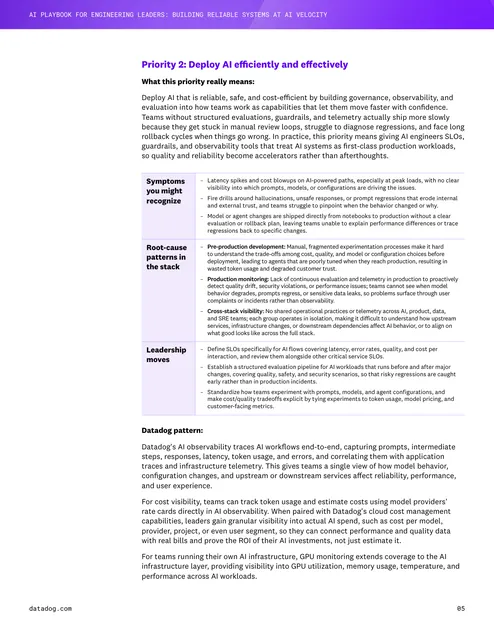
The starting point: a playbook in tables
Datadog’s playbook sets out four priority plays and three enabling capabilities for running AI in production, each with the symptoms a team might recognize, their root causes and the moves leaders can make. It closes with a maturity model and a 90-day checklist. In print, that diagnosis lives in dense three-column tables, and the reader has to do the matching in their head.
The brief
A playbook is only useful if a leader can work out which plays apply to their team. The edition had to do that diagnosis with them.
Diagnose, then plan
Let readers tick the symptoms they recognize as they read, then carry those answers into the playbook’s four-step plan.
Make reliability tangible
SLOs, evaluations and feedback loops are abstract until you move a target and watch two weeks of results respond.
Stay faithful
The playbook’s wording, customer proof points and footnote numbering stay as printed. Simulations say they are simulations.
Who it is for
Engineering leaders running AI features in production: CTOs, VPs of engineering, platform and SRE leads.
Executives
Take the Quick track through the executive summary and plays, then check their maturity stage in four questions.
Engineering managers
Tick symptoms across the plays to build a pain map and turn it into a one-page plan.
Practitioners
Use the Deep track and the simulations to argue for SLOs, evaluations and agent identities with evidence.
From PDF to edition, chapter by chapter
Every section shows the printed page numbers it covers, from 01 to 16.
| Chapter | The playbook’s point | In the interactive edition |
|---|---|---|
| 1 · Foreword (p. 01) | AI velocity needs reliable systems | A read-aloud foreword and a choice of Quick or Deep-dive track |
| 2 · Executive summary (pp. 01–02) | Teams must move from “try AI” to “prove AI”; governance lags behind | A governance question that places the reader’s team against survey data the playbook cites |
| 3 · Plays and capabilities (pp. 03–13) | Four priority plays and three enabling capabilities, each with symptoms, root causes and leadership moves | Seven sections with tickable symptoms and a simulation each: a trace, SLO targets, an autonomy sort, a feedback loop, a latency curve, a change log and an evaluation |
| 4 · Putting it into action (pp. 13–14) | A four-step approach and what “good” looks like | A pain map built from the reader’s ticks and a planner for the four steps |
| 5 · Maturity and 90 days (pp. 14–16) | Four maturity stages and a 90-day checklist | A four-question self-check using the stage descriptions word for word, and the checklist |
| 6 · Conclusion (p. 16) | From AI bets to evidence-driven systems | A five-question quiz, the playbook’s footnotes 1–11 and a readout to copy, share or print |
What Studio Vektor did
Turned a reference document into a guided diagnosis that ends with something to act on.
Made the tables tickable
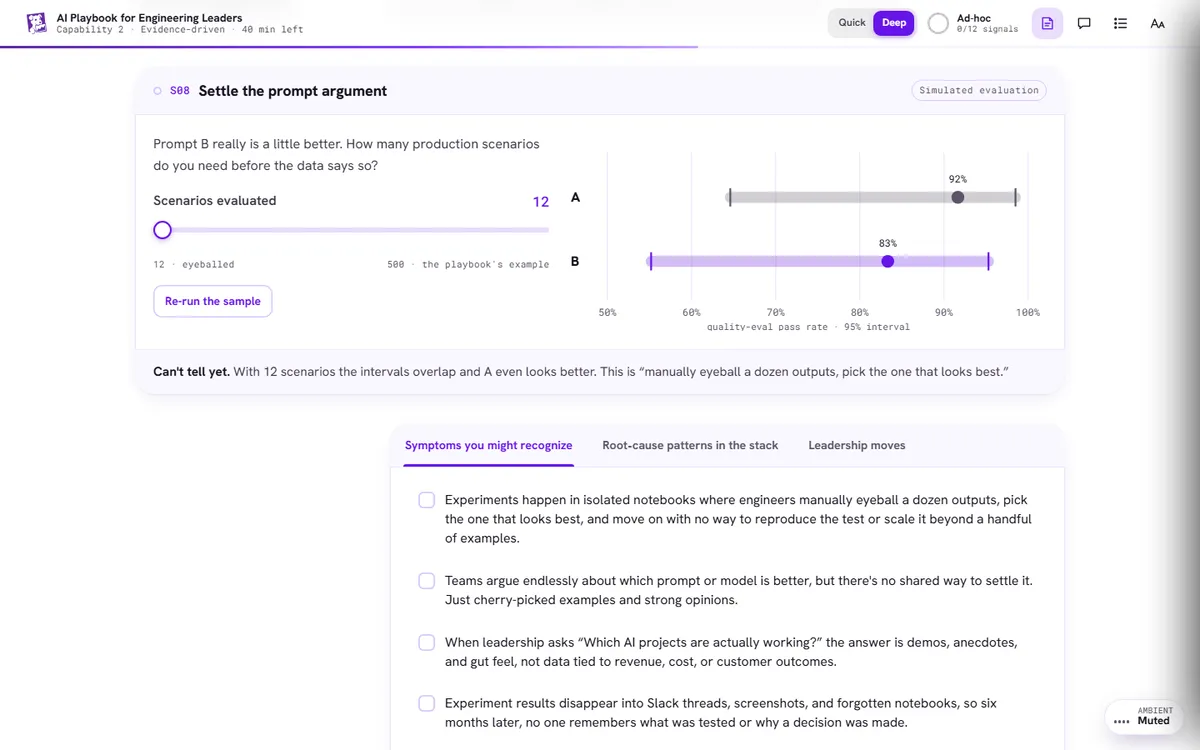
Each play’s symptoms, root-cause patterns and leadership moves sit in tabs, and every symptom can be ticked. The ticks build a pain map later in the book.
Gave each idea a simulation
Readers set SLO targets and watch two simulated weeks respond, drag an evaluation from 12 to 500 scenarios until the result is clear, and guess who made each change in an incident log.
Ended with a plan
The four-step planner suggests focus areas from the pain map. The finished plan becomes a one-page readout the reader can copy, share or print.
Kept the proof points
The customer stories the playbook cites (Fintool, Cvent and AppFolio) stay in place, and each simulation built on one says which figures come from the case study.
The 12 signals
Each interaction lights one of twelve signals. The header shows the reader’s progress, using the playbook’s maturity stages from Ad-hoc to Evidence-driven.
| Signal | Type | What the reader does |
|---|---|---|
| 01 · The governance gap | Benchmark | Says whether their team could reconstruct what an agent did last night, and sees how the survey answered |
| 02 · Trace one query | Trace view | Replays a trace before and after load balancing and inspects each span (p. 04) |
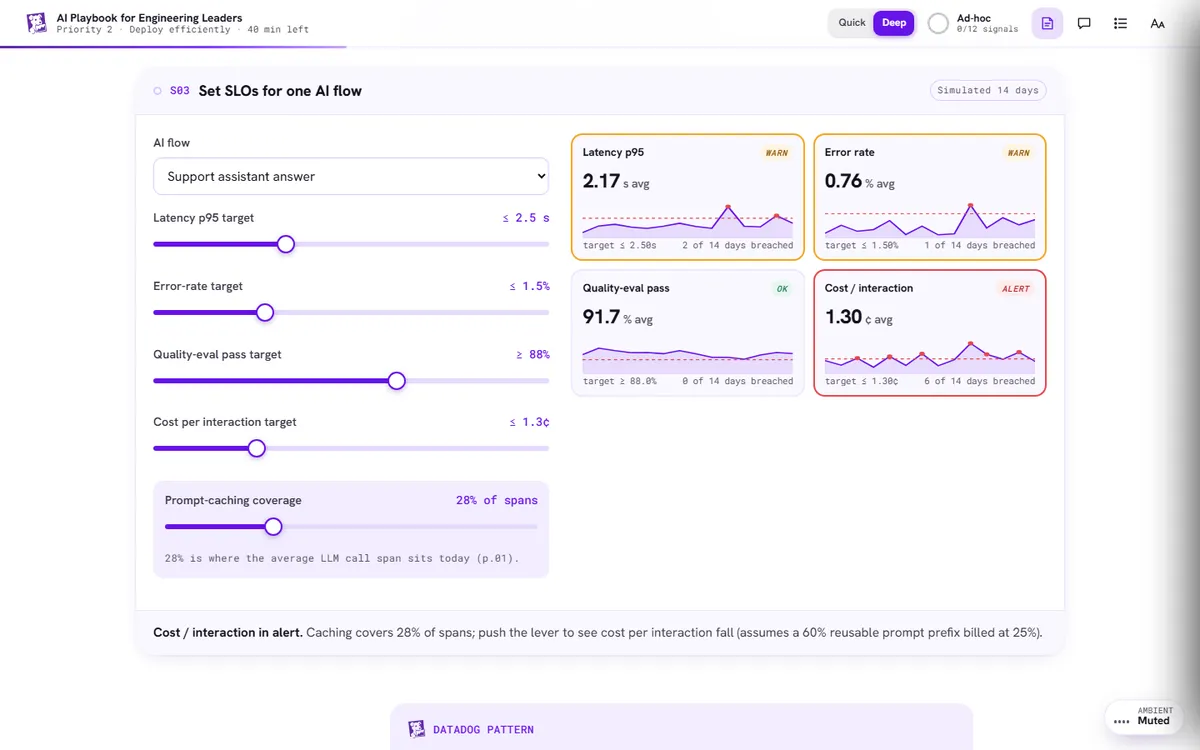
| 03 · Set SLOs | Simulation | Sets latency, error, quality and cost targets for one of three AI flows over 14 simulated days (p. 05) |
| 04 · Draw your autonomy line | Sorting | Sorts eight jobs into agent-handled and human-approved, with feedback quoting the playbook |
| 05 · The full feedback loop | 16-second animation | Watches a production failure become a test case |
| 06 · Faster means used | Illustrative curve | Drags latency down and watches adoption respond (pp. 08–09) |
| 07 · Who made this change? | Scenario | Guesses the actor behind six changes in an incident, then turns on agent identities (p. 10) |
| 08 · Settle the prompt argument | Simulated evaluation | Increases scenarios from 12 to 500 until the data shows which prompt is better (pp. 11–12) |
| 09 · Your pain map | Built from answers | Sees every symptom they ticked, grouped by play and capability |
| 10 · Four-step plan | Planner | Fills the playbook’s four steps, with focus areas suggested from the pain map (p. 13) |
| 11 · Where are you today? | Self-check | Answers four questions to find their maturity stage (pp. 14–15) |
| 12 · Checkpoint | Quiz | Answers three multiple-choice and two true-or-false questions, each linked to where the playbook says it |
Reading experience and accessibility
The printed playbook becomes one responsive edition that adapts to how much time the reader has.
Two tracks
A Quick overview for leaders and a Deep-dive implementation track with every paragraph and margin note.
Listen along
A read-aloud foreword with sentence tracking and playback speed, using the reader’s device voice.
Reading settings
Text size, Auto, Light, Dark and Sepia themes, dyslexia-friendly type, bionic emphasis, margin notes and calm motion.
Announced results
Twenty-one live regions announce simulation results, diagnoses and quiz feedback.
Sources kept
Footnotes 1–11 follow the printed numbering, with the PDF’s own links.
Take it to the team
The readout can be copied, shared or printed, and progress saves in the browser.
Design system
Datadog’s violet runs from the cover through every control, with monitoring-style charts for anything that measures.
- Datadog purple
#632CA6Brand and headings - Bright violet
#6614E8Actions and selections - Night
#13072ECover and dark panels - Lavender
#F3EDFEWidget backgrounds - Health states
#2BB673 → #E5484DOK, warning and alert, as in a monitor
Type
Hanken Grotesk for display and reading, Roboto Mono for metrics, labels and page references, and Atkinson Hyperlegible for the dyslexia-friendly mode.
Speaks the reader’s language
Traces, SLO tiles and change logs look like the tools engineering teams already use, so the ideas map straight onto their work.
Labels on every widget
Tags such as “Simulated 14 days” or “Illustrative · endpoints from AppFolio” say exactly where each number comes from.
How it’s built
A playbook gets revised as practice changes. The build keeps content, simulations and the planner separate.
| Aspect | Approach |
|---|---|
| Delivery | One self-contained HTML file (about 285 KB) with its images embedded. No platform, plugin or reader app. |
| External requests | The web fonts, with system-font fallbacks, and a page-view analytics tag |
| Simulations | Simulated data drawn as HTML and SVG charts in the page, so every control changes the result straight away |
| Narration | The reader’s device voice through the Web Speech API, with sentence tracking |
| State | Ticks, plan, signals and settings saved in the reader’s browser |
PDF vs interactive edition
The PDF is the reference. The edition is the working session.
| Question | Original PDF | Interactive edition |
|---|---|---|
| Which plays apply to my team? | Read seven tables and match by eye | Tick symptoms and see them gathered in a pain map |
| What does a good SLO look like? | A description | Move targets and watch two simulated weeks |
| How many test cases are enough? | A statement about evidence | An evaluation that shows the intervals separate |
| Where are we on the maturity model? | Four stage descriptions | Four questions and an answer |
| What do we do next? | A 90-day checklist | A four-step plan to copy, share or print |
What we would measure
This edition is an independent demonstration with no audience data, and we don’t report results for it. For a platform vendor, a playbook like this is a qualification tool.
Pain points
The symptoms readers tick show which problems the audience has, by play and capability.
Maturity mix
Self-check results show how many readers are Ad-hoc, Siloed, Unified or Evidence-driven.
Intent
Plans completed, readouts shared and clicks from the closing section to a demo request.
Where this approach fits
Any guide that ends with “here’s what to do” can end with the reader’s own plan instead.
Leadership playbooks
Frameworks with plays or pillars, where a diagnosis decides which ones matter.
Maturity models
Stage-based models where a short self-check replaces a page of descriptions.
Technical buyer guides
Guides for engineering buyers, where simulations make the vendor’s argument with evidence.
FAQ
Common questions about this edition and projects like it.
Was this edition commissioned by Datadog?
No. It is an independent portfolio demonstration built from an eBook Datadog published. The playbook is Datadog’s; the editorial layer, interactions, design and build are Studio Vektor’s.
Is the data in the simulations real?
No. The simulations use simulated data to show how each idea behaves, and each says so. Figures from the playbook and its customer stories are labelled where they appear.
What would an edition like this cost?
Interactive eBooks start from $635, and the Advanced package with one defined quiz or scoring tool and interactive charts starts from $1,170. An edition at this depth, with twelve signals, simulations and a planner, goes beyond those packages and is quoted on scope after we see your playbook.
Can readers’ plans reach our sales team?
In this demonstration, answers stay in the reader’s browser. In a commissioned edition, the readout can feed a form or your marketing automation, with the reader’s consent.
Publishing a playbook?
Let readers finish with their own plan.
Playbooks, frameworks and maturity models work especially well. Send the PDF and we’ll show you how.