

- Studio Vektor
- Interactive eBooks
- Gong: 2026 State of Revenue AI
Case study · Interactive report
2026 State of Revenue AI, a report that teaches by doing
Gong’s report draws on 1,048 revenue leaders and 7.1 million opportunities. The interactive edition gives each chapter a different way to read the data: compare years, drag through deployment stages, quiz yourself and view every chart through your own market.

- Publisher
- Gong (Gong Labs)
- Original format
- 23-page landscape PDF report
- Edition
- 6 insights, 6 badges, a market lens
- Status
- Independent portfolio demonstration
An interactive edition of a report Gong published. Survey and Gong Labs figures are as published; the gists, practitioner notes, quizzes and badges were written for this edition by Studio Vektor. Not commissioned by, affiliated with or endorsed by Gong.


The starting point: a data-heavy research report
The report combines a survey of 1,048 US revenue leaders with Gong Labs analysis of 7.1 million sales opportunities to describe six insights: growth is stalling, productivity has become the top initiative, AI depth beats breadth, and AI is moving from tool to teammate. In print it is 23 widescreen pages of charts, each with one fixed view.
The brief
A report with this much data needs more than one way in. The edition had to give each chapter its own reading pattern.
A pattern per chapter
Compare years in one chapter, drag through stages in the next, test recall in another.
Readers’ own market
Let readers pick the market they sell in and spotlight it across the report.
Reward exploring
Six badges for using the data widgets, the quiz, read-aloud, highlights, tracks and finishing.
Who it is for
CROs, sales leaders, revenue operations and enablement teams.
Revenue leaders
Compare their growth and quota attainment with peers.
RevOps and enablement
See how AI deployment depth relates to revenue growth.
International teams
Use the market lens for the US, UK, Germany or Australia.
From PDF to edition, chapter by chapter
The edition follows the report’s six insights.
| Chapter | The report’s finding | In the interactive edition |
|---|---|---|
| Introduction | The AI economy rewards those who redesign around it | Six insights from 1,048 leaders and 7.1M opportunities, and a choice of reading track |
| The growth engine stalls | Growth slowed to 16%; reps hitting quota fell from 52% to 46% | A growth-by-company-size chart that compares 2024 and 2025, and a four-question micro-quiz |
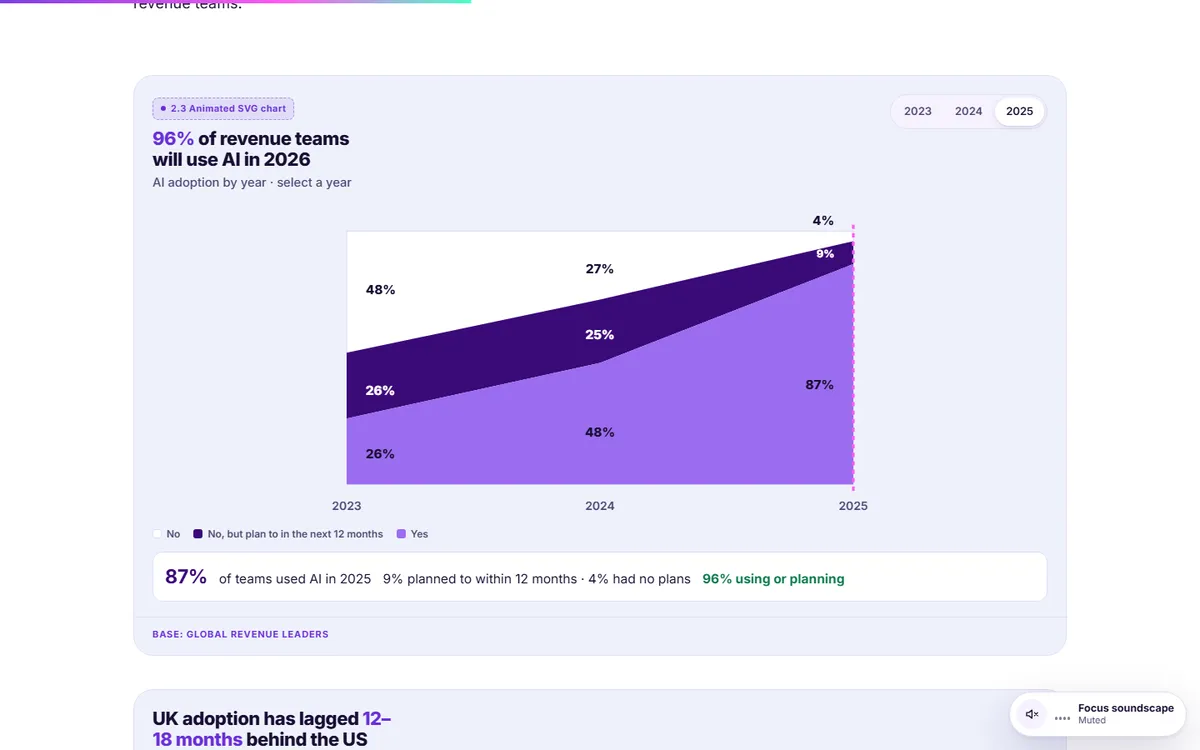
| Productivity takes the wheel | Productivity is now the top growth initiative, and 96% of revenue teams will use AI in 2026 | A gist card, read-aloud and an adoption chart to step through 2023, 2024 and 2025 |
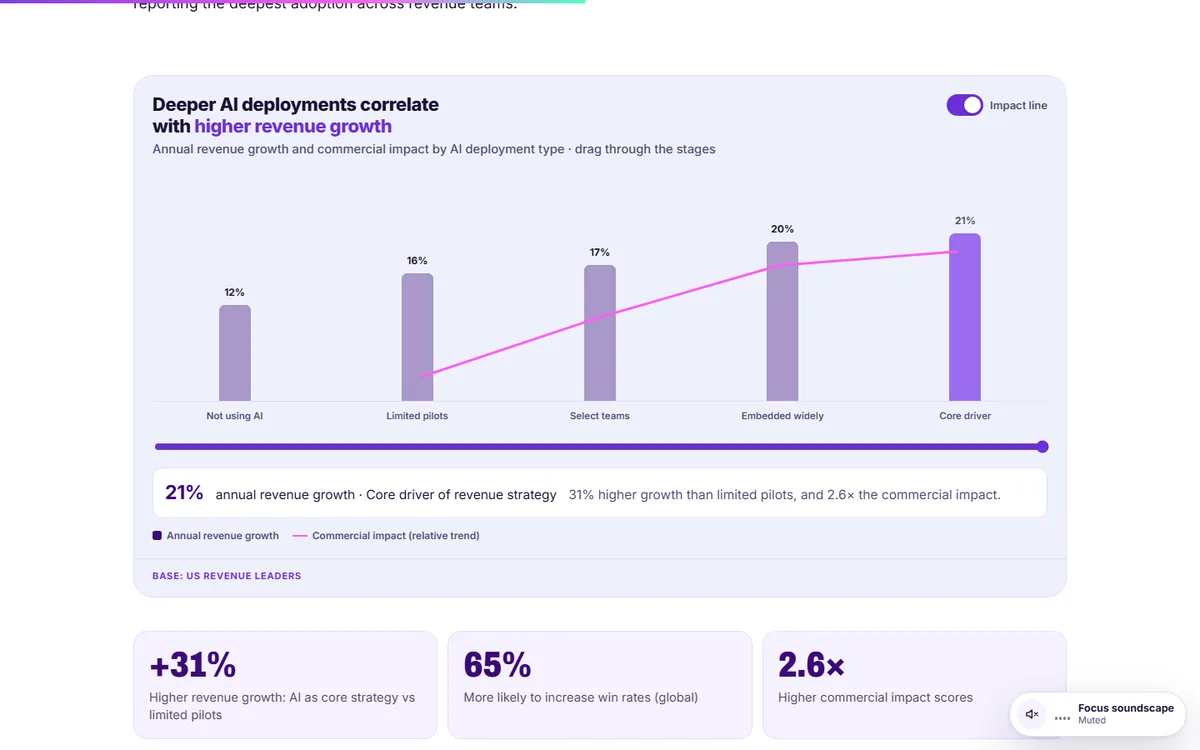
| Depth beats breadth | Deeper AI deployments correlate with higher revenue growth | A chart to drag through deployment stages, use-case adoption by share or growth, and skepticism by country |
| From tool to teammate | AI-driven revenue teams generate 77% more revenue per rep | A revenue-per-rep chart with an uplift toggle, and the market lens |
| Engineering change | Run productivity like a product launch | The playbook for 2026 |
What Studio Vektor did
Gave every chapter a different way to read the data.
Varied the pattern
Toggle charts, slider charts, step-through years, micro-quizzes and gist cards, each chosen for the finding it carries.
Added a market lens
Readers pick the US, Australia, Germany or the UK; the choice is remembered and spotlighted in later charts.
Quizzed in context
A four-question micro-quiz sits right after the growth findings, with explanations.
Rewarded the reader
Six badges for exploring data, acing the quiz, listening, annotating, switching tracks and finishing.
Key interactives
Each chapter uses a different interactive reading pattern.
| Interactive | Type | What the reader does |
|---|---|---|
| Growth by company size | Compare chart | Compares 2024 and 2025 growth across company sizes |
| Micro-quiz | Quiz | Answers four questions on growth, quota and opportunities |
| AI adoption by year | Animated chart | Steps through 2023, 2024 and 2025 |
| Deployment stages | Slider chart | Drags from no AI to core driver |
| Use-case adoption | Sortable chart | Sorts AI use cases by 2025 share or growth |
| Skepticism by country | Comparison | Compares skepticism of AI insights across four markets |
| Revenue per rep | Toggle chart | Shows the uplift from occasional and frequent AI use |
| Your market lens | Personalization | Picks a market that is spotlighted in other charts |
| Badges | Progress | Earns six badges for exploring, listening, annotating and finishing |
Reading experience and accessibility
Twenty-three widescreen pages become one responsive report with several ways in.
Reading tracks
Switch tracks with live reading times; Quick keeps gists and every chart.
Listen along
Read-aloud with word or sentence tracking at 0.75× to 1.5×, using the reader’s device voice.
Reading settings
Text size, Auto, Light, Dark and Sepia themes, dyslexia-friendly type (Atkinson Hyperlegible) and bionic emphasis.
Highlight, share and comment
Readers can highlight passages, share them or open a sample discussion.
Announced results
Eleven live regions announce chart and quiz results.
Notes and definitions
Terms such as quota attainment are defined under the charts that use them.
Design system
Gong’s deep purples with pink and mint for data and highlights.
- Gong purple
#4A0F9CBrand and chart panels - Violet
#7B3FE4Bars and selections - Pink
#FF5CF0Trend lines and highlights - Mint
#4DFFC7Key figures on dark panels - Deep
#1E0050Cover and dark grounds
Type
Archivo for display, Inter for reading and interface, and Atkinson Hyperlegible for the dyslexia-friendly mode.
Numbered patterns
Each interactive carries a pattern label, such as track switch or animated SVG chart.
Bases under every chart
Each chart states its base, such as US revenue leaders or Gong Labs opportunities.
How it’s built
Gong publishes this research every year; the charts read from data in the page so the next edition can reuse them.
| Aspect | Approach |
|---|---|
| Delivery | One self-contained HTML file (about 215 KB) with its images embedded. No platform, plugin or reader app. |
| External requests | The web fonts, with system-font fallbacks, and a page-view analytics tag |
| Narration | The reader’s device voice through the Web Speech API, with word or sentence tracking |
| State | Answers, progress and settings saved in the reader’s browser |
PDF vs interactive edition
The PDF reports the findings. The edition gives readers several ways to explore them.
| Question | Original PDF | Interactive edition |
|---|---|---|
| How did my size band do? | One chart for all | A chart that compares years by size band |
| Does AI depth matter? | A chart and a claim | Drag through deployment stages |
| What about my market? | Country figures scattered | A market lens across the report |
| Did I take it in? | No check | A micro-quiz and badges |
What we would measure
This edition is an independent demonstration with no audience data, and we don’t report results for it. For a revenue-intelligence company, the market lens and quiz answers segment the audience.
Market mix
Which markets readers choose.
Engagement
Badges earned and charts explored.
Intent
Quiz completion and clicks to the vendor’s site.
Where this approach fits
Large research reports benefit from more than one way to read them.
Annual benchmarks
Reports where each finding deserves its own chart pattern.
Multi-market research
Editions where readers set their own market once.
Data stories
Reports that teach with quizzes as well as charts.
FAQ
Common questions about this edition and projects like it.
Was this edition commissioned by Gong?
No. It is an independent portfolio demonstration built from a report Gong published. The research is Gong’s; the editorial layer, interactions, design and build are Studio Vektor’s.
Are any figures changed?
No. Charts show the published figures and their bases; interactions only compare, sort and spotlight them.
What would an edition like this cost?
Interactive eBooks start from $635, and the Advanced package with one defined quiz or scoring tool and interactive charts starts from $1,170. An edition at this depth, with a different pattern per chapter, a market lens and badges, goes beyond those packages and is quoted on scope after we see your document.
Can next year’s report reuse the build?
Yes. Charts read from data in the page, so next year’s figures can replace this year’s and the patterns carry over.
Publishing annual research?
Give every chapter its own way to read the data.
Annual benchmarks and multi-market research work well. Send the report and we’ll show you how.